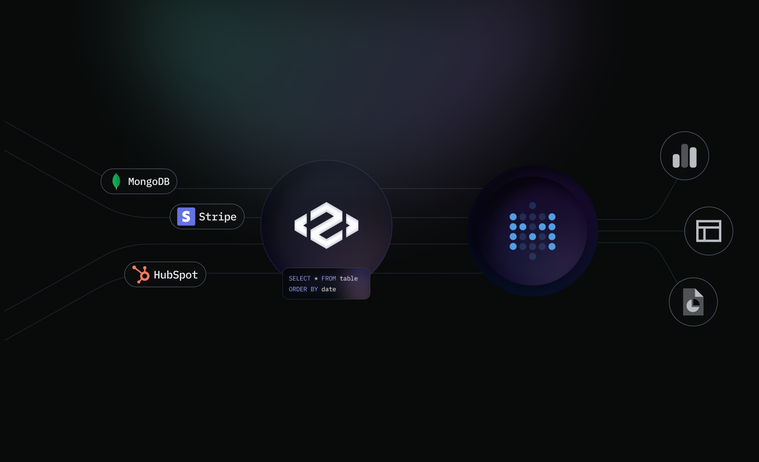
Visualize Your Data with Peaka’s Metabase Integration
Having introduced an innovative way of integrating data with data virtualization and zero-ETL, our next task at Peaka was to help our users make the most of their unified data.
Instead of investing precious engineering hours into building a more-of-the-same data visualization module, we’ve decided to pair Peaka with top-notch business intelligence (BI) tools you are familiar with. These BI integrations will allow you to turn your tabular data into charts and dashboards that tell a story. The first such tool is Metabase.
What is Metabase?
Metabase is an open-source business intelligence (BI) tool that connects to more than twenty commonly used data sources. In addition to its free open-source tier, the platform offers different packages with varying levels of capability at different price points.
Here’s a quick look into some of the features that set Metabase apart in a crowded BI tool market:
Visual Query Builder
Metabase removes a technical barrier with its Visual Query Builder, facilitating self-serve analytics for everyone in an organization. Thanks to this feature, even non-technical employees with limited or no knowledge of SQL can query and dissect their data for business insights. In addition to drag-and-drop querying, Metabase also offers highly adjustable access controls, helping determine who gets to access what.
Native Query Editor
For those proficient in SQL, Metabase’s native query editor is the way to go when they need to drill down into the data. Developers, data analysts, and data scientists can use this tool to write queries as text, slice their data as they see fit, and create templates and reusable code snippets for later use.
Pre-built visualizations
A host of pre-built visualizations make it easy for Metabase users to view their data as charts and dashboards and share their insights. They can embed these visualizations, dashboards, or the entire Metabase app in their products and web pages.
X-ray
Once you turn your data into charts and dashboards, Metabase also allows you to analyze your data from different perspectives. With Metabase, users can apply different filters and break their data down into its components as they look for explanations for changes. The X-ray feature facilitates data exploration and insight generation, providing users with an automatically generated dashboard of questions, which helps when you don’t know where to start.
What is Peaka?
Peaka is an innovative data integration platform that makes it easy to bring together data from different sources and share the consolidated data across different systems and applications.
Zero-ETL data platform
Peaka was developed as a zero-ETL data platform for startups and SMBs to replace the modern data stack, which is too expensive to set up, too complicated to use, and too demanding to maintain.
Peaka leverages data virtualization to unify data without complex and time-consuming ETL processes. It turns your data into virtual tables, creating a semantic layer over relational and NoSQL databases, SaaS tools, and APIs. This semantic layer allows users to query disparate data sources as a single source right away.
Serverless connector infrastructure
In addition to its zero-ETL data integration capability, Peaka also functions as a serverless connector infrastructure for its customers.
Building connectors at scale is a formidable challenge for even enterprises, much less startups. Shipping a single integration can take weeks or even months. Due to the scarcity of engineering resources, startups find it extremely difficult to build the connectors their customers demand at a quick rate. Maintaining these connectors is even harder, especially because version changes in third-party APIs cause connectors to malfunction and require extensive work to fix.
Peaka’s serverless connector infrastructure empowers startups to quickly launch “white-label” SaaS connectors without hassle. These connectors are always up-to-date, scalable, and capable of performing at a high level, which reduces development costs for startups, enables them to respond to connector requests right away, and minimizes maintenance costs.
What does Peaka’s Metabase integration do?
Peaka’s Metabase integration adds new dimensions to Peaka’s data integration capabilities.
Extensibility
Metabase currently integrates with more than twenty databases and data warehouses. Thanks to data virtualization, Peaka can go beyond this and connect Metabase with other data sources like SaaS tools and Google Sheets documents. Peaka’s Metabase integration extends this capable BI platform so it can visualize data regardless of where it resides.
Single view of truth
Nowadays, even a typical startup or SMB has fragmented data due to the tens of different SaaS applications and spreadsheets they use. Without breaking down these silos and incorporating SaaS data, it is impossible to form a single view of truth. Peaka’s new integration solves this problem by connecting Metabase to SaaS platforms it currently does not support.
360-degree view of customers
Users can leverage Peaka to run join queries on disparate data sources and view the results with Metabase, thanks to Peaka’s Metabase integration. Incorporating data from different sources allows for a 360-degree view of customers, making it easier for decision-makers to spot patterns and trends and create more effective marketing campaigns.
Conclusion
Data visualization is a powerful instrument for extracting information from your consolidated data and making sense of it. That’s why at Peaka, we put a special emphasis on building integrations with the most popular BI tools. These integrations will enable you to form a single view of truth for your business and unlock insights that you would not be able to draw from tabular data.
Click here to access the how-to guide on on Peaka's Metabase integration.
Check out Peaka’s growing library of custom connectors and book a free demo to see Peaka in action!


 Please
fill out this field


