Reveal What Your Data Has to Tell with Tableau Integration
One of the biggest challenges for companies today is putting data in the hands of domain experts who can use it for insights. This requires unifying the data that is scattered across different systems, applications, and databases and then serving it to users searching for that specific piece of data. Business intelligence (BI) tools play a crucial part in this process as they convert tabular data into visualizations and help form a narrative out of it.
Peaka launched a series of BI integrations in the summer of 2024 to give users a set of first-rate options for viewing their data. The last of these integrations brings you Tableau, the popular BI tool known for its dazzling visualizations.
What is Tableau?
Tableau was founded by three Stanford University researchers in 2003. After becoming one of the most popular BI tools in the market, Tableau was acquired by Salesforce for $15.7 billion in 2019. Today, the platform’s free version, Tableau Public, boasts more than 3 million user accounts, which is a sign of its reach and monetization potential.
If you care about the visual appeal of your reports, hardly any product offers nicer visualizations than Tableau. In addition to a large suite of charts, Tableau also comes with various maps to communicate geospatial data, adding a new dimension to the story your data can tell. Tableau accelerators, pre-made dashboard templates users can leverage to visualize their data right away, make self-service data visualization possible, enhancing ease of use for users with limited technical skills.
Tableau has been the gold standard in data visualization for the last decade. Its visual appeal and high customizability played a big part in the platform’s success. However, there is more to its success than meets the eye:
-
The platform can handle large datasets, making it a good fit for the enterprise use case.
-
It offers some data modeling capability along with well-defined access permissions.
-
It supports both SQL and visual querying, although the latter (called VizQL) involves a steep learning curve.
-
The Level of Details (LOD) feature provides advanced analytics at different levels of visualization, enabling users to customize their calculations according to their needs.
-
On the connectivity side of things, Tableau integrates with a wide range of data sources, including major data warehouses and databases. Its native connectivity with the apps within the Salesforce ecosystem gives the platform a leg up in the enterprise environment, where both Salesforce and Tableau are rather popular.
What is Peaka?
Peaka is a platform that is purpose-built to serve the data integration needs of startups and SMBs. Before Peaka, these organizations used to either pay for enterprise-grade solutions they did not need or had to make do with spreadsheets to unify their data.
Data integration is a highly technical process that can be intimidating for the uninitiated. Peaka simplifies this process by eliminating the ETL process. As a result, users can retrieve their data from disparate systems and applications with one click and push this consolidated data to other applications.
In addition to being a zero-ETL data integration platform, Peaka also serves as a serverless connector infrastructure. Let’s take a brief look at these two use cases:
Zero-ETL data integration platform
The modern data stack is a set of tools and technologies to collect, process, store, and analyze data. The cornerstone of the modern data stack is the extract-transform-load (ETL) process. Since ETL is a complex process built around data pipelines that are hard to build and maintain even with a data team, startups cannot afford these enterprise-grade solutions.
Peaka revolutionizes this field with its zero-ETL approach, which removes the transformation stage from the ETL process. Zero-ETL is based on the data virtualization technique, which virtualizes data as relational databases, removing the need to physically copy and move data from one location to another. Establishing a semantic layer over your data sources, Peaka allows you to query every data source using SQL, run join queries to merge data from different sources, and create a single view of truth for everyone in the organization.
Serverless connector infrastructure
Another use case Peaka excels at is basically functioning as a serverless connector infrastructure and helping startups launch connectors at scale.
Tech startups find it hard to gain traction because responding to the connector requests of their prospects can be an overwhelming task. Building a single connector takes weeks, if not months, so a founder willing to close deals should employ a large data team that can ship connectors at a fast enough rate so leads can be converted before they turn cold. Building those connectors in-house also means a long-term commitment to maintain and update them, which multiplies the effort needed from a team already stretched thin with daily operations.
Peaka provides users with a serverless connector infrastructure they can use to launch “white-label” connectors that are scalable and always up-to-date. By shipping tens of connectors in the time it would take to ship just a few, startups can close deals faster and focus on growing instead of allocating resources to maintain and update connectors.
What does Peaka’s Tableau integration do?
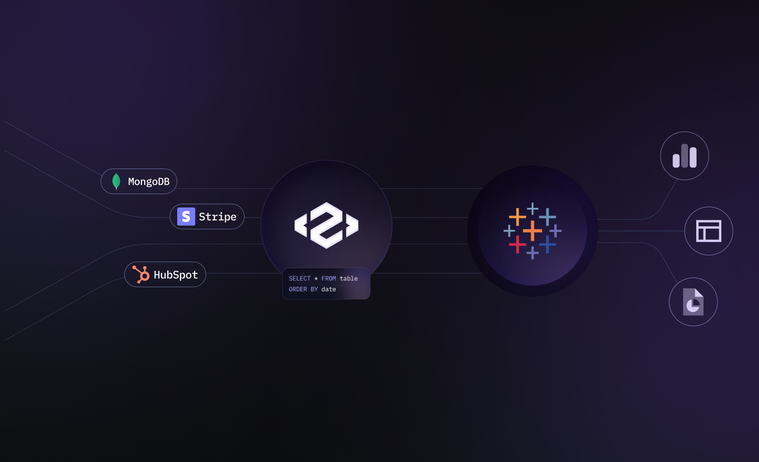
Peaka’s collection of BI integrations aims to meet users where they are the most comfortable, enabling them to view their data with their favorite BI tools. Our Tableau integration serves the same purpose and gives users another option to view the data they unified with Peaka.
Although Tableau supports integrations with a host of data sources, Peaka goes beyond that as a dedicated data integration platform, allowing users to retrieve data from relational and NoSQL databases, APIs, and hundreds of SaaS platforms. Users can leverage Peaka to join data from different tools and create new datasets. They can then expose those new datasets to other systems and applications or feed them to a BI tool like Tableau to generate reports and dashboards.
Tableau seamlessly integrates with other apps in the Salesforce ecosystem, making this BI tool all the more attractive to Salesforce users. Peaka empowers these users to merge their Salesforce data with data from other platforms and gain visibility into different aspects of their operations. Thanks to Peaka’s Tableau integration, sales and marketing people can conduct customer segmentation at a more granular level and turn their reports into visualizations that tell a story.
Conclusion
The different offerings in the BI tools market have their strengths and shortcomings. Each choice comes with a trade-off. Therefore, it is essential to pick the right tool for the job to be done.
If you work for an enterprise, deal with vast amounts of data, and prioritize the visual appeal of your charts and dashboards while having access to a capable IT team for data modeling purposes, Tableau is the tool for you. If this description does not fit your use case, you can always try one of Metabase, Apache Superset™, Power BI, and Looker Studio integrations for your data visualization needs.
Check out Peaka’s growing library of custom connectors and book a free demo to see Peaka in action!


 Please
fill out this field


