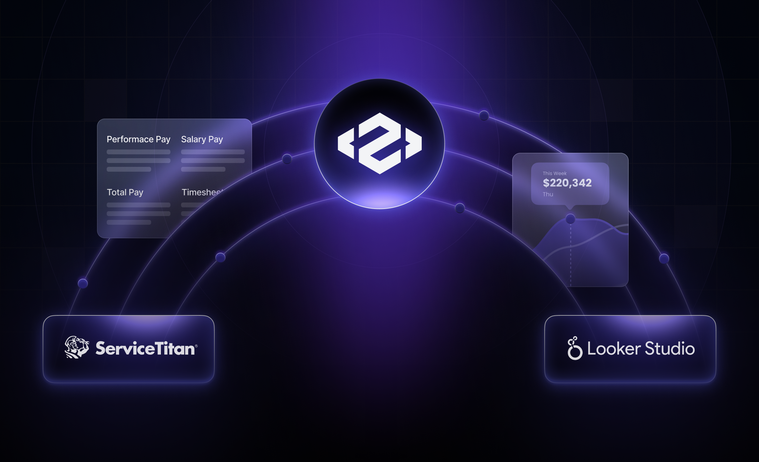
Connecting ServiceTitan to Looker Studio with Peaka
Being data-driven is the goal for every organization today, be it a startup, a conglomerate, or a government agency. It might be the tech companies that popularized the concept, but data lies at the heart of every major strategic decision, performance evaluation initiative, or the culture of accountability leaders are willing to establish. That’s why even the modest plumbing business in your neighborhood is seeking ways to make better use of its business data.
In this blog post, we are looking into ServiceTitan, a popular platform for the trades and filed service businesses, and how its data can be leveraged to provide the insights its users seek.
What is ServiceTitan?
ServiceTitan is a specialized platform that home service businesses (“the trades,” in ServiceTitan speak), such as plumbing, electrical, and HVC services, can use to manage their operations. Developed to provide an end-to-end experience for home service businesses, ServiceTitan streamlines the process of scheduling appointments, managing customer calls, tracking and documenting progress through forms, photos, and videos, and monitoring customer satisfaction.
In addition to centralizing business data, ServiceTitan also presents all this information as a dashboard. This dashboard offers a quick view of the state of business through charts, graphs, and metrics. It comes with a certain level of customization so users can view the job status, bookings, cancellations, revenue, and other valuable information, depending on the specific needs of a business.
One of the more versatile platforms in the market, ServiceTitan doubles as a CRM and a communication panel you can use to keep tabs on the fieldwork being done. Its marketing tab combines marketing analytics with Google Ads campaigns being run, providing an integrated user experience for business teams.
What is Looker Studio?
Looker Studio is Google’s business intelligence solution. This platform went by the “Data Studio” name until 2022 when Google decided to rename it “Looker Studio.” This rebranding led to some confusion as Google also has the Looker platform for data modeling.
Just like Power BI is the go-to platform for visualizing data within the Microsoft ecosystem, Looker Studio functions as the default data visualization tool for users in the Google ecosystem. Looker Studio addresses the needs of business teams that are willing to generate reports and draw insight from their data without relying on a data team.
One of the defining characteristics of Looker Studio is its ease of use. While Tableau requires users to possess technical skills to fully leverage its capabilities, Looker Studio targets a non-technical user base and offers a few features that enable these users to self-serve:
-
Simple UI: An easy-to-use interface makes Looker Studio accessible to marketing and growth teams willing to make data-driven decisions without waiting for engineers to generate reports for them.
-
Native integration with Google products: Looker Studio supports seamless connectivity with Google platforms such as Google Analytics and Google Ads, which are extremely popular with marketing and growth teams.
-
An extensive library of connectors and integrations: Looker Studio boasts a collection of more than 20 connectors for the most popular data sources that were built in-house. Additionally, it offers over a thousand partner connectors that are built and maintained by third parties, so users can pull in data from almost any source.
-
Pre-made visualizations: Another way Looker Studio empowers non-technical users is through the pre-made visualizations it provides. These templates give users a simple and creative way to turn their data into slick charts and graphs that communicate a story.
-
Data modeling with LookML: Tech-savvy users can connect Looker Studio to LookML and define data relationships, creating a data modeling layer so other users do not need to access the database or the data warehouse.
ServiceTitan’s dashboard capabilities
ServiceTitan does a great job of unifying all the data that managers and field workers in the home service business need. It can pull in data from a host of data sources. As of November 2024, it supports integrations with over a hundred different platforms, from accounting and tax software to business intelligence tools and human resource management platforms.
ServiceTitan has a very robust reporting feature that allows you to pick from hundreds of different attributes to build custom reports. You can then leverage the platform’s built-in dashboard to visualize these reports.
For administrators and managers, the ServiceTitan dashboard offers a wide range of metrics and KPIs:
-
Company metrics related to revenue and sales that help monitor how well the business is doing,
-
Metrics related to calls, bookings, and conversions that sum up the business opportunities these decision-makers are interested in,
-
Scorecards for Customer Service Representatives that help link the performance of call center staff to leads and bookings,
-
Scorecards for technicians that help link job completion rates and average response times to the performance of field workers.
All these metrics can be further broken down by using date filters, making trend analysis possible by visualizing the data from the last 18 months or 26 weeks.
Why should you connect ServiceTitan with Looker Studio?
What if you want to go off the beaten path and improvise with the metrics and KPIs you’re tracking on ServiceTitan? Then, things get more complicated.
Metrics to gauge overall business performance (revenue, operational expenses, financing), job progress (inbound calls, job completion rates, average response times, and materials used), and customer sentiment (customer reviews or survey results) are infinitely customizable according to a company’s needs. ServiceTitan’s dashboard is good at providing the basics, but will probably come up short for niche data visualization needs. That’s when purpose-built business intelligence tools come into play.
There are several reasons for using a dedicated data visualization tool like Looker Studio to view your ServiceTitan data: You may already be familiar with the capabilities of Looker Studio or just find it convenient to stay within the Google ecosystem.
However, the fact that ServiceTitan does not support integration with Looker Studio makes things a little bit tricky. Left to your own devices, you can manually export your ServiceTitan data to a spreadsheet and then feed this data to Looker Studio for visualization. But keep in mind that this spreadsheet will not update automatically and will require you to keep exporting data whenever you want to update your dashboard.
Benefits of using Peaka to visualize your ServiceTitan data with Looker Studio
Wouldn’t it be nice if you had a data platform that supports integration with both ServiceTitan and Looker Studio? You’re in luck because that would be Peaka.
Peaka is the ideal platform to bridge the capabilities of ServiceTitan and Looker Studio. Being a Looker Studio partner, it offers seamless integration with this BI tool. It also boasts a ready-made connector for ServiceTitan, facilitating data extraction from this platform.
Peaka virtualizes your ServiceTitan data, allowing you to join it with data from sources like other CRMs, relational databases, and SaaS tools. Having formed a new dataset from your consolidated data, you can send it to Looker Studio and leverage the pre-made visualizations to whip up dashboards instantly.
This effortless data flow from ServiceTitan to Looker Studio via Peaka reduces the workload on data teams, which business units depend on to generate reports. It helps minimize the IT backlog from the marketing and growth teams and channels precious engineering hours to more productive tasks. This kind of connectivity also eliminates the risk of human error that would result from having to continuously update spreadsheets manually. It is a no-brainer for any organization invested in these two platforms and willing to unlock efficiencies.
Conclusion
ServiceTitan serves as a central repository of knowledge for the trades. It not only collects a huge amount of data from the field but also turns that data into detailed reports decision-makers can use. However, some of its users might be looking for more advanced dashboard capabilities, which dedicated data visualization tools like Looker Studio can provide in spades.
Peaka is the ideal middleware for connecting ServiceTitan to Looker Studio. As a result of this connection, tradespeople end up having a top-notch CRM like ServiceTitan with top-notch data visualization capabilities.
Visit our documentation to see how you can connect ServiceTitan to Peaka and read our step-by-step how-to guide on Peaka-LookerStudio integration.
Check out Peaka’s growing library of custom connectors and book a free demo to see Peaka in action!


 Please
fill out this field


