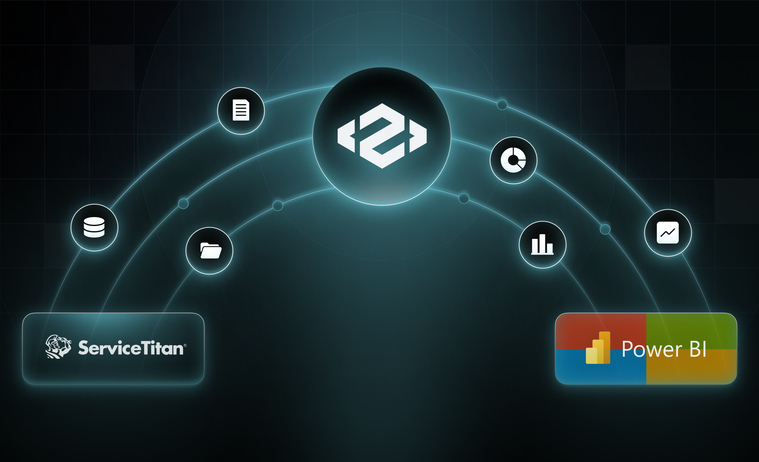
Connecting ServiceTitan to Power BI with Peaka
It is a must for white-collar employees to be data-driven nowadays. Regardless of the company size, every decision-maker has metrics and KPIs to track, which puts immense pressure on these people to make better decisions and improve performance.
This phenomenon is not limited to global companies, either. Just because you don’t rake in millions in ARR or know what ARR is does not mean you can’t be data-driven.
Blue-collar jobs need to be data-driven as well. Whether you are running a plumbing, lawn-mowing, cleaning, or HVAC service, gathering your business data and leveraging it to make better decisions is the only way to grow your revenue and optimize your resource utilization.
One company that recognized home service businesses’ need for data early on was ServiceTitan. Founded in 2007, this California-based company capitalized on the software needs of tradespeople, reaching more than 8,000 customers and $685 million in ARR this year with a year-on-year growth rate of 23 percent. The company filed for an IPO in November 2024 and reached a valuation of $8.9 billion in its Nasdaq debut on December 12.
What is ServiceTitan?
ServiceTitan is a dedicated CRM platform designed for home service companies, commonly referred to as “the trades,” such as cleaning, plumbing, electrical, and HVAC services, to oversee their operations. The platform serves as a comprehensive software suite for these businesses, helping them manage appointments, evaluate employee performance, handle customer calls, track job progress, and monitor customer satisfaction.
ServiceTitan goes beyond the usual CRM duties and offers other functions a small business needs. It is an all-in-one platform that can handle purchasing, inventory management, and communications. Its integration with Google Ads shortens the time between insights and marketing campaigns, helping local companies run more effective campaigns.
One ServiceTitan feature that simplifies things for business teams is the dashboard. This capability enables users to turn their data into charts, graphs, and metrics so they can uncover trends in their business operations, albeit with limited personalization options.
What is Power BI?
Power BI is Microsoft’s business intelligence solution. It is designed and developed to be a part of the Microsoft product range and thus complements the company’s other software products rather well. For people who are used to working with Microsoft products, Power BI offers visualizations they can use to view their centralized data.
Google and Microsoft have tried to be everything to their users for some time now. Whatever you need —an email account, a spreadsheet, a data warehouse, or a whole cloud infrastructure— these companies have it for you. By doing that, they have raised switching costs for customers while offering them a better user experience and receiving brand loyalty in return.
Power BI is similar to Looker Studio as both platforms serve as the data visualization tools of their respective ecosystems, minimizing friction for users as they allow data virtualization while still staying within a product ecosystem. However, they are quite different tools in their capabilities and target users. While Looker Studio emphasizes ease of use with a simple UI and pre-made visualizations, PowerBI serves a broader range of use cases as it is more customizable than its Google counterpart.
Here are the two aspects Power BI shines in:
Interoperability with other Microsoft products
Microsoft has a product offering for almost any business need, from Azure to Office 365 to Teams. Power BI is embedded in this ecosystem as the go-to data visualization solution. If you are comfortable working in this environment, making your data flow from one node to another, Power BI is the natural destination for turning your data into visualizations. This native connectivity benefits users when they want to share their reports with other Microsoft services, promoting data consistency across different teams.
Multi-purpose use
Another strength of Power BI is its versatility, which saves companies from deploying different tools for different teams. A company can use Power BI to serve both its business users with limited technical skills and data teams willing to drill down into reports. This prevents duplicate expenses on tools that will do the same job and improves productivity as data is easily shared across different business units.
The ServiceTitan dashboard
ServiceTitan fills a big void in the market with its CRM functions specialized for home service businesses and integration capability. It not only stores customer data but leverages integrations with more than a hundred different platforms to blend this data with data from accounting, tax, payment, or human resource management platforms.
ServiceTitan users can turn this consolidated data into reports by ticking the boxes in a long list of attributes according to their needs. The next step is to visualize these reports with the platform’s built-in dashboard.
This dashboard does a respectable job of visualizing data, allowing users to track a host of metrics and KPIs that can be grouped into four:
-
Business metrics help gauge the overall business performance with figures related to sales, revenue, and conversion.
-
Call metrics help uncover the business opportunities reflected in the number of calls, bookings, and conversions.
-
Customer Service Representative metrics help evaluate the performance of a call center employee based on the number of inbound calls booked, taken, and leads generated.
-
Technician metrics help monitor the performance of technicians based on their average response time and job completion rates.
Date filters enable users to view the data from the last 18 months and conduct trend analysis on these metrics. Trend analysis can then be used to make projections and inform decision-making.
ServiceTitan provides customers with two pre-made dashboards they can use to track basic metrics:
-
Business status dashboard for keeping an eye on the lead pipeline and job progress,
-
Commercial dashboard for viewing the revenue- and sales-related metrics.
The platform also offers customization options for its dashboards in case the pre-made ones are not up to the task.
Why should you connect ServiceTitan with Power BI?
Home services are not practiced the same way everywhere: Local practices, regulations, habits, and customs have a significant impact on the way these businesses operate. Therefore, companies tend to have different reporting needs, and customization goes a long way toward satisfying these needs.
ServiceTitan offers a decent dashboard capability, but it is bound to struggle when customization requirements become too granular. A dedicated data visualization tool comes in handy in such times and provides a tried-and-tested solution to the common data visualization problems that regular users experience.
Power BI enjoys an advantage over its competitors as most SMBs run the Windows operating system and use Microsoft products such as Office 365. Power BI seamlessly integrates with and pulls in data from such products, which simplifies things while working in this particular ecosystem. However, visualizing ServiceTitan data with Power BI is not a straightforward process because ServiceTitan does not support integration with the latter.
A determined user looking for a workaround user can manually copy and export ServiceTitan data to a spreadsheet and send it to Power BI for visualization. Yet, this can’t be a one-and-done project, as the spreadsheet will have to be continuously updated. Considering the number of reports a home service business needs on a regular basis, it is safe to say that such a task won’t be popular with the employees.
Benefits of using Peaka to visualize your ServiceTitan data with Power BI
If only there were a tool that could streamline data flow from ServiceTitan to Power BI… A tool that could be operated without a data team so business units could generate reports and create dashboards without manual labor or being dependent on tech people.
The conventional data integration process usually involves a data warehouse and data pipelines. You pay for a data warehouse and copy your data from different sources, moving it to a central repository where you can query it. You build data pipelines between the source and your data warehouse to ensure that your data is modeled to fit the format your destination requires. This is where things get tricky because any change in the input or output format requires a data team to build new data pipelines and maintain them, which would be prohibitively costly for a home service business or an SMB.
Peaka eliminates this costly problem by virtualizing your data, basically creating an avatar of your data so you don’t need to physically move it to a data warehouse. This principle applies to ServiceTitan, as well. Thanks to Peaka’s ServiceTitan connector, you can easily retrieve data from this source and join your ServiceTitan data with data from other sources, such as CRM, SaaS tools, or internal databases. Peaka allows you to query your fractured, siloed data as if it were one in one single repository, use filters to create new datasets, and send them to BI tools such as Power BI, Looker Studio, Metabase, and Tableau for viewing. All without investing in a data warehouse or having to maintain data pipelines.
The result?
-
Reduced workload for data teams, which would otherwise have to spend significant time and effort to build and maintain data pipelines to respond to the requests of business units.
-
Saved engineering hours that can be channeled to more productive tasks.
-
Less room for human error as there is no need for manually copying and pasting data.
-
Savings from not investing in a data warehouse or a bigger data team.
Final thoughts
ServiceTitan is an outstanding CRM for the trades. It centralizes all the data such a business has, helps organize daily work, and allows users to see and evaluate the results. With an advanced reporting capability that gives user visibility into every aspect of the business, ServiceTitan deserves to be complemented by a top-notch dashboard.
If you are a ServiceTitan user, Power BI is one of the best purpose-built business intelligence tools available. Connecting these platforms can be problematic, though, because ServiceTitan does not offer a connector for Power BI. Peaka solves this problem by acting as a middleware between the two, allowing you to seamlessly send your ServiceTitan data to Power BI.
Visit our documentation to see how you can connect ServiceTitan to Peaka.
Looking to connect ServiceTitan to Looker Studio? Make sure you read our blog post on the topic.
Check out Peaka’s growing library of custom connectors and book a free demo to see Peaka in action!


 Please
fill out this field


